Flow Debugging
Runtime node state
While in play mode, nodes can be either not running, running or completed.
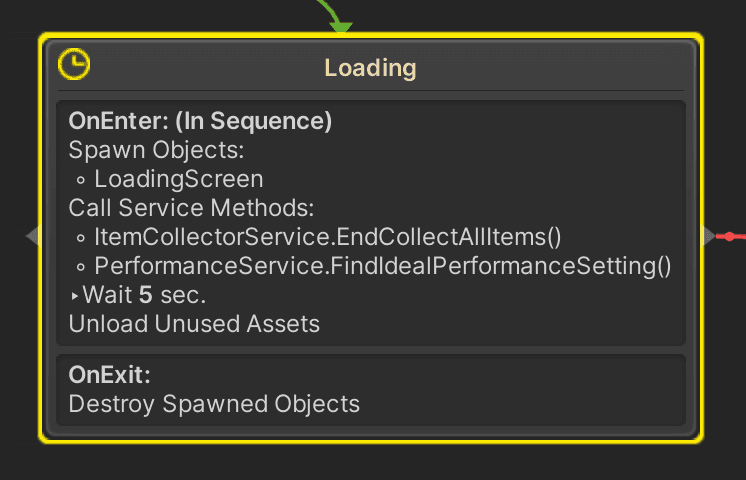
A yellow outline and a clock icon indicate a node is currently active and still executing actions assigned to the node.
On the executing nodes, in front of the name of the action, a small play icon :material-play: appears while that specific action is executing. In the following image, there is a small play button in front of the Wait 5 sec. action which indicates it is currently running that action in the list.
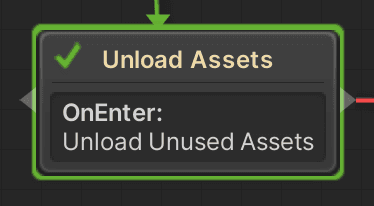
When all actions have been completed the node changes from yellow to green with a checkmark:
Enter state
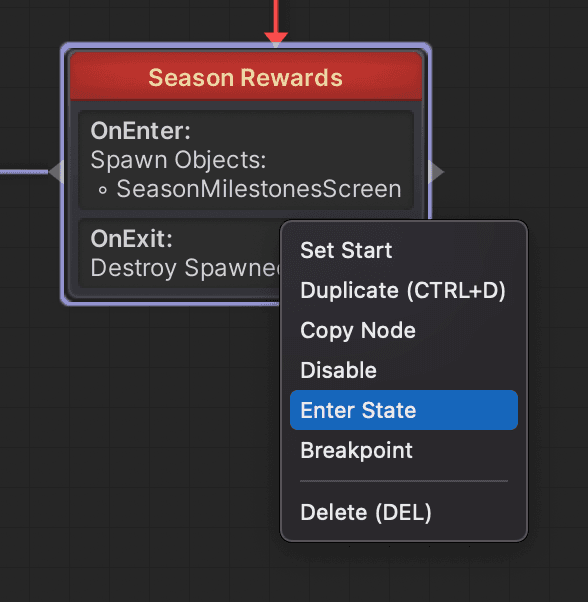
While the application is running, nodes can be activated at any point in the editor. Select a node and pick Enter State from the right click dropdown menu.
Breakpoints
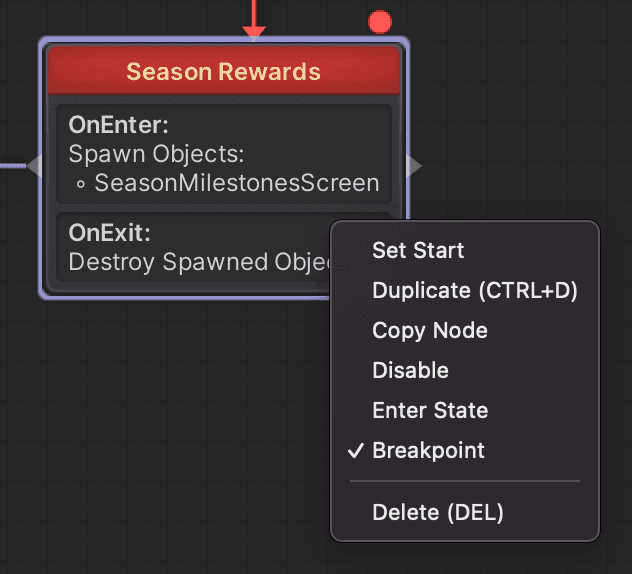
From the same dropdown menu, breakpoints can be toggled on or off on nodes as well.
Nodes with breakpoints are indicated by a red dot at the top of the node. When the graph activates this node, the editor is paused in the same way as using Debug.Break() in code. Click the Unity play/pause button at the top to continue running the app.
Debug menu
The debug menu under Game State > Flow are 3 tools to help navigating and testing the flow.
Debug Events
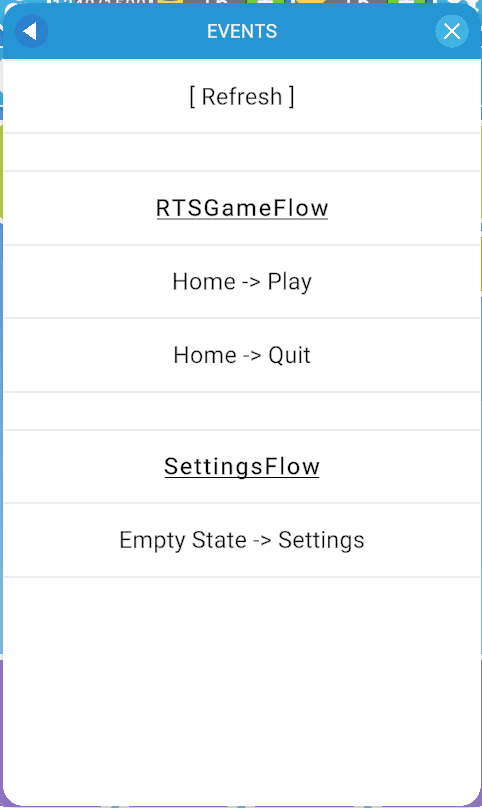
This shows all the active node transitions with a FlowEvent on them and allows you to manually trigger the events.
The underlined and bolded text is the name of the FSM asset. The events themselves are indicated by the Node Name -> Event Name syntax.
Click an event to trigger it. The debug screen will automatically refresh.
This debug menu allows for multiple ways of interacting with the flow:
- Navigate the app without interacting with the menus.
- Go to places inaccessible to the user, such as having the special events menu accessible only to developers.
- It can also be used to cheat through the game, by getting the game to send a win or lose event.
The events should automatically update while navigating through the flows, but in case the events are not up to date, press the [Refresh] button at the top to force a manual refresh of the events.
Debug Nodes
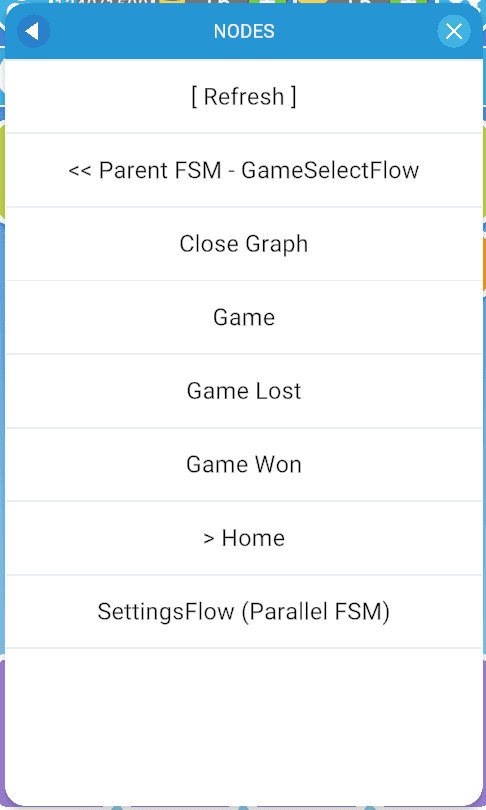
This screen shows you to navigate the entire flow, with all nodes and sub/parallel FSMs.
Any node with a > in front of it is currently active.
Navigate back up to the parent FSM by pressing the << Parent FSM button.
Tap any node to jump to it instantly.
Sub FSM exploring
Going into a sub FSM which is not active at the moment will activate it and go to the Start node in this flow.
Jumping anywhere
Be aware that activating any other node can result in unwanted behaviors. As the app is no longer taking the intended path, some screens or states may persist when jumping anywhere else in the app.
Debug Variables
All blackboard variables can als be explored through the debug menu.
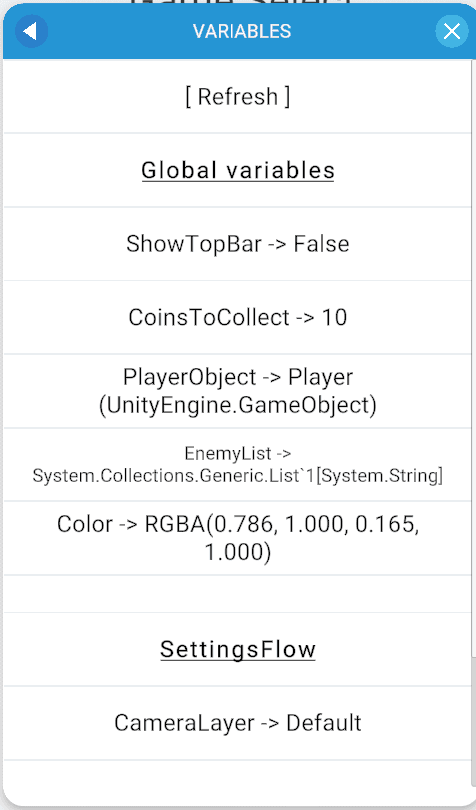
Use this debug menu to see what the blackboard is doing at any point on device as well.
Open it using the debug menu and go to Game State > Flow > Variables to view all the blackboard variables.
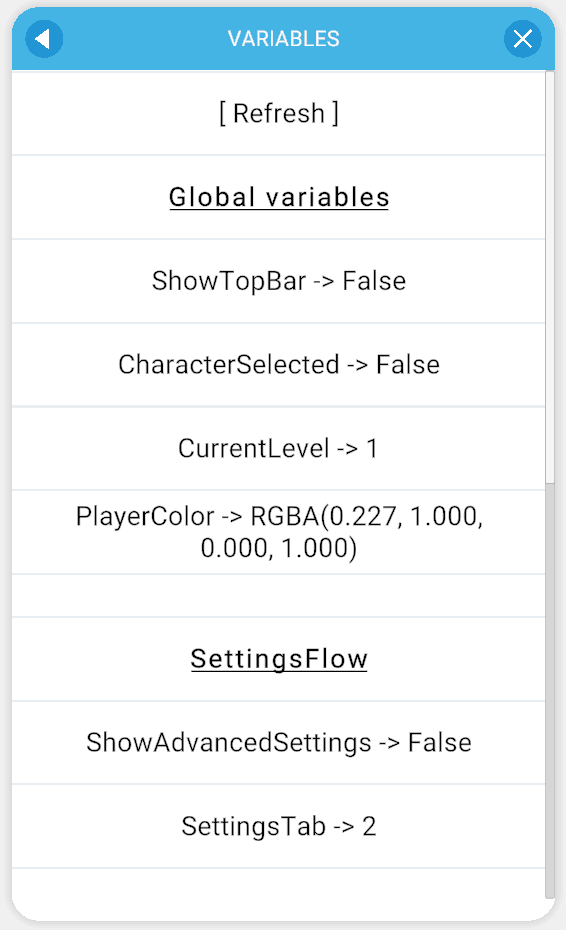
Tapping on some variables types allows changing the values, currently supported are:
- Booleans: toggle between true - false
- Enums: jump through all the enum values one at a time
The rest of the variables are converted and showed as a string format. Click the [Refresh] button at the top to refresh the screen to the latest content.
This debug menu allows testers to take certain cheat paths through the flow, showing or hiding screens or changing the game state just to name a few examples.